flowchart LR
  A[Construct] --Operationalization--> B[Variable]
Quantitative Analysis and Labor
Goals for Today
- Overview of quantitative methods
- The use of polling and survey data
- Where to find polling and survey data
Who am I?
- I’m Kevin Reuning (ROY-ning).
- I’m an Associate Professor in Political Science.
- My research focuses on American politics, especially political parties, social movements, and the media.
- Within this is a focus on how we can better measure political phenomenon.
- I’m a proud member of Faculty Alliance of Miami, AAUP-AFT.
What I want from you
- Stop me to ask questions.
- I know you all have very different backgrounds from me (and often from each other).
Setup
- Quantitative methods focus on identifying the relationship between two variables
- The cause variable is the independent variable
- The effect variable is the dependent variable
- Putting them together identifies a hypothesis . . .
Example
Higher rates of union coverage lead to lower levels of inequality.
Types of Relationships
Two types of relationships:
- Relational: Two variables are related to each other but it is not clear that one causes the other.
- Causal: One variable clearly causes the other variable to change
Most research starts with relational hypotheses before moving to causal hypotheses.
Measurement
- Construct: The underlying concept that you are interested in.
- Operationalization: The rules or process that is applied to turn that into a quantitative measure.
- Variable: The measure that is used in your analysis.
Measurement Example
- Construct: The extent of economic inequality in a state.
- Operationalization options:
- Calculate the percent of wealth owned by the top 1 percent.
- Divide the income of the top 90th percentile by the income of the 50th percentile.
- Calculate how much the income distribution differs from a perfectly equal distribution (Gini Coefficient)
Types of Variables
Variables are differentiated by their attributes (the levels that a variable can take)
- Nominal variables: The attributes have no logical order.
- Ex: Categorizing employees by the factories they work at.
- Ordinal variables: The attributes have a logical order, but the differences in the levels are fuzzy.
- Ex: Categorizing employees by the “prestige” of their job.
- Interval variables: The attributes have a logical order and the differences are clear.
- Ex: How long an employee has worked in a position.
Variable Example
Hypothesis
Higher rates of union coverage lead to lower levels of inequality.
- Inequality: Measured by the gini coefficient.
- Interval variable from 0 to 1 where higher levels mean more inequality.
- Union coverage: Measured by the percent of employees that are members of a union.
- Interval variable
Variable Example


Testing Relationships
There are a lot of ways to test for relationships between variables, and the specifics will depend on:
- What types of variables you are testing.
- How you are dealing with (if at all) the need to identify a causal relationship (more later).
Example
We can look then at how our inequality and membership relate to each other by plotting them and fitting a line of best fit.
Example

Example

Limits
This is a pretty limited test of this, it doesn’t account for other possible explanations:
- Political factors
- Differences in industry
- Variation overtime
Better Example

Different Types of Quantitative Research
They often vary in the units that are in your data.
- Cross-sectional: You compare units at the same time point but across different situations.
- Time series: You compare a unit with itself at different time points.
- Panel: You compare multiple units overtime,
There is also a distinction made between observational research, experiments and natural experiments.
Experiments
- There is an increasing interest in using experiments in quantitative research
- Experiments are the ‘gold standard’ in identifying causal relationships.
- The key idea in an experiment is that researcher randomly assigns individuals different levels of the independent variable (the treatment)
Natural Experiments
- Natural experiments are an alternative to traditional experiments
- Instead of the researcher “treating” your units you look for a case where nature “treated” your units.
- Ex: Looking at the effects of May Day parades by looking at what cities had rain on May 1st.
Survey Research
Surveys can be used to capture opinions, behaviors, and experiences of voters.
- Population: The set of individuals that a survey wants to make claims about (Often “voters” or “all adults”)
- Sampling Frame: The individuals that survey researchers can potentially sample to take their survey.
- Sample: The set of individuals who actually take the survey.
Sample Size
There is a known relationship between sample size and amount of error in your sample:
- As sample size increases the amount of error in your sample decreased.
- The decrease in error is not linear, larger samples reduce error by smaller amounts.
Population

Sampling 10

Sampling 100

Sampling 500

Sampling 1000

Increasing Samples

Response Rate
- The biggest concern with surveys right now is decreasing response rates.
- Response rates for traditional phone surveys are around 5%.
- This becomes an issue when the individuals who respond to surveys are systematically different from those who don’t once we account for known factors.
- i.e. the white men between the ages of 18 and 35 with college degrees who take the survey are different than the white men between the ages of 18 and 35 with college degrees who did not take the survey.
Survey Data
There are a few big surveys that are done regularly:
In each of these you can download the data directly and ANES and GSS have tools for you to do analysis online.
ANES - Union Membership and Partisanship

iPoll
- Penn State has access to the Roper iPoll database
- Organizations that field surveys provide their data (though not all provide it to the same degree).
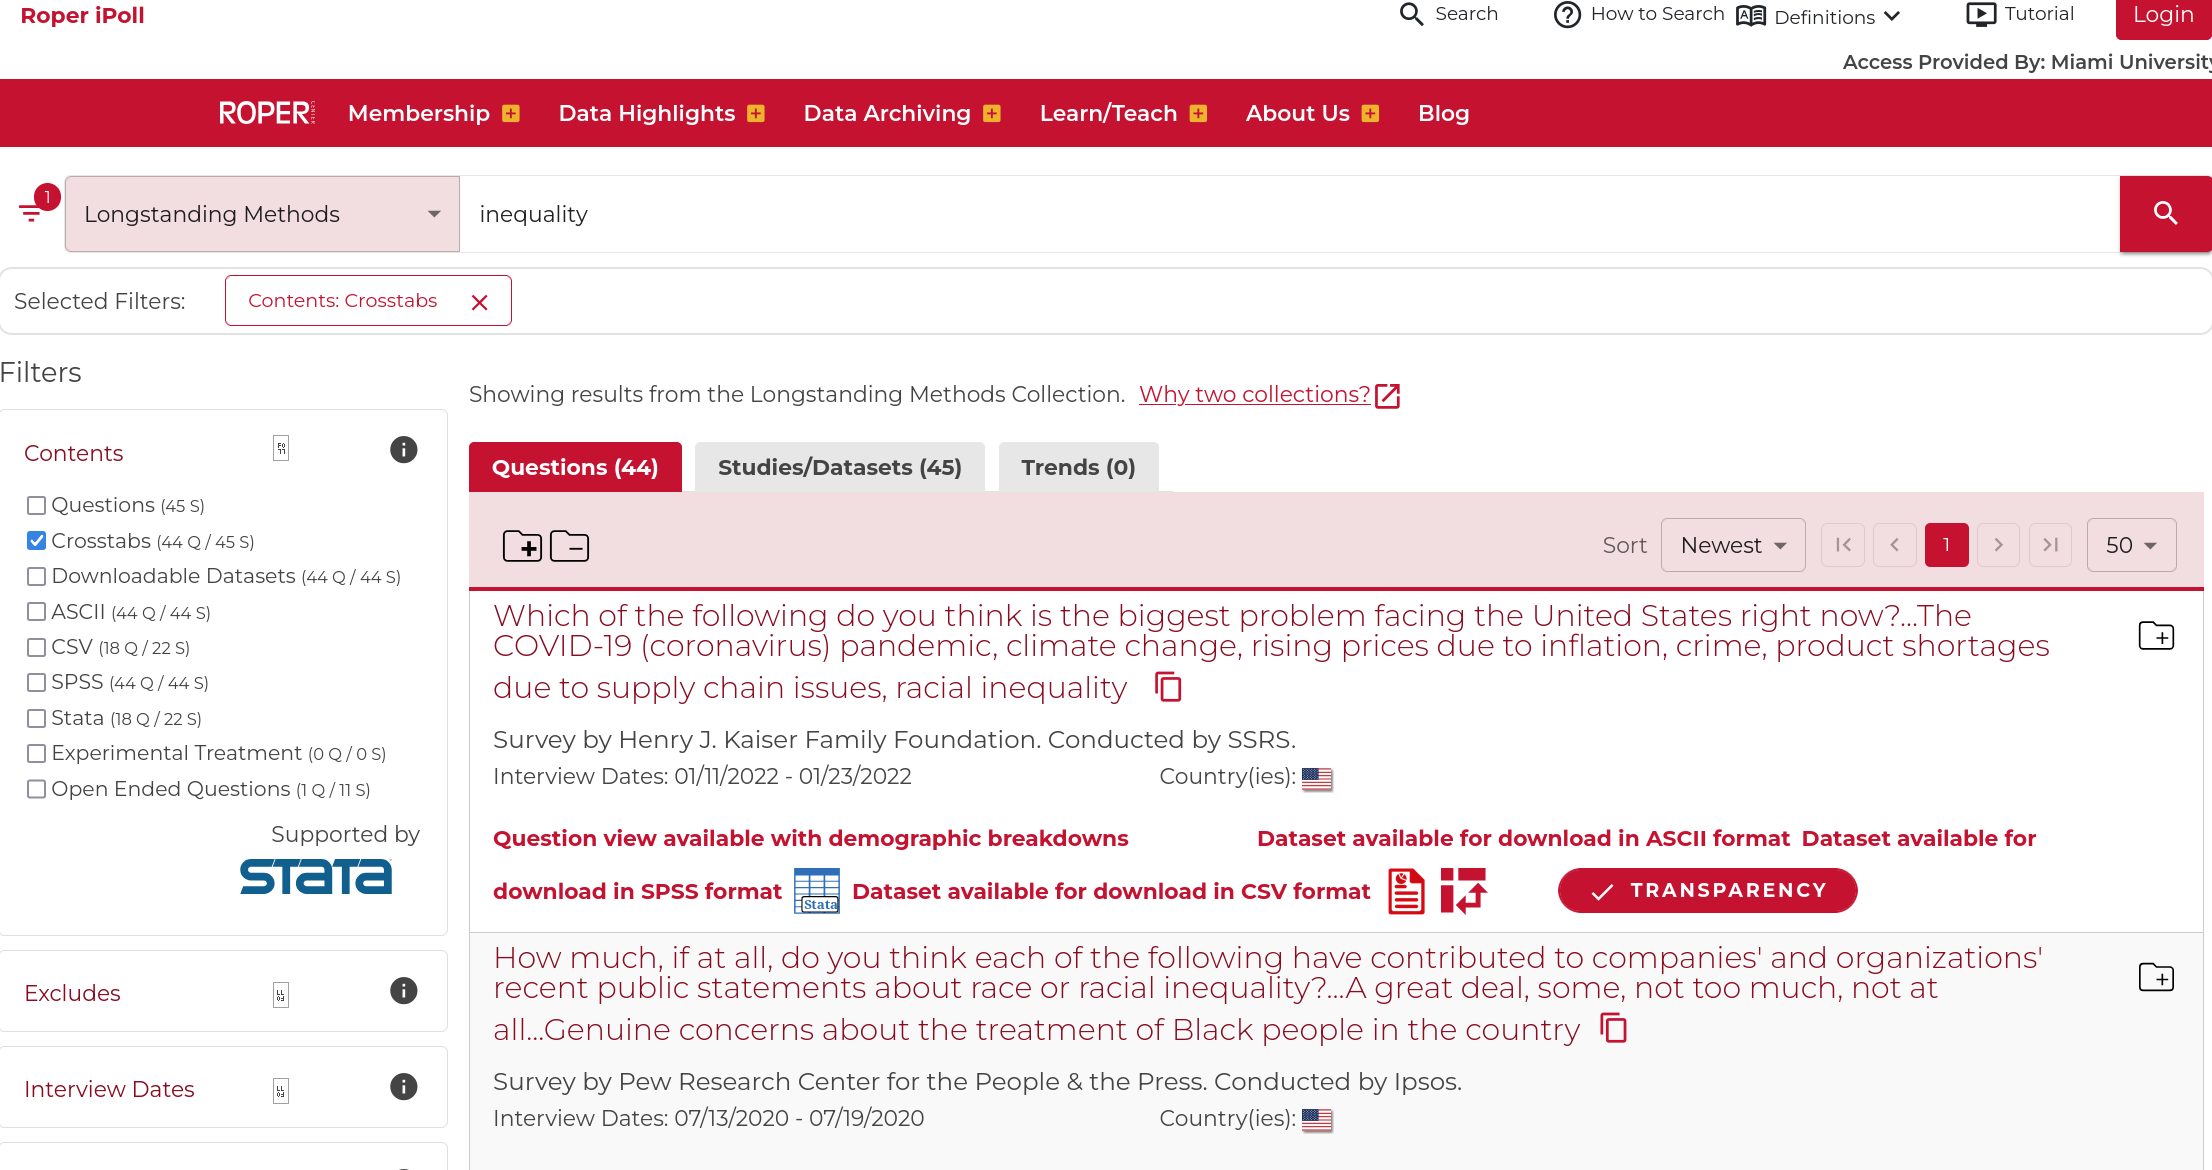
iPoll Example

iPoll Example
If you want to look at differences across subgroups you can check the “crosstabs” option which will limit your search to polls that include crosstabs

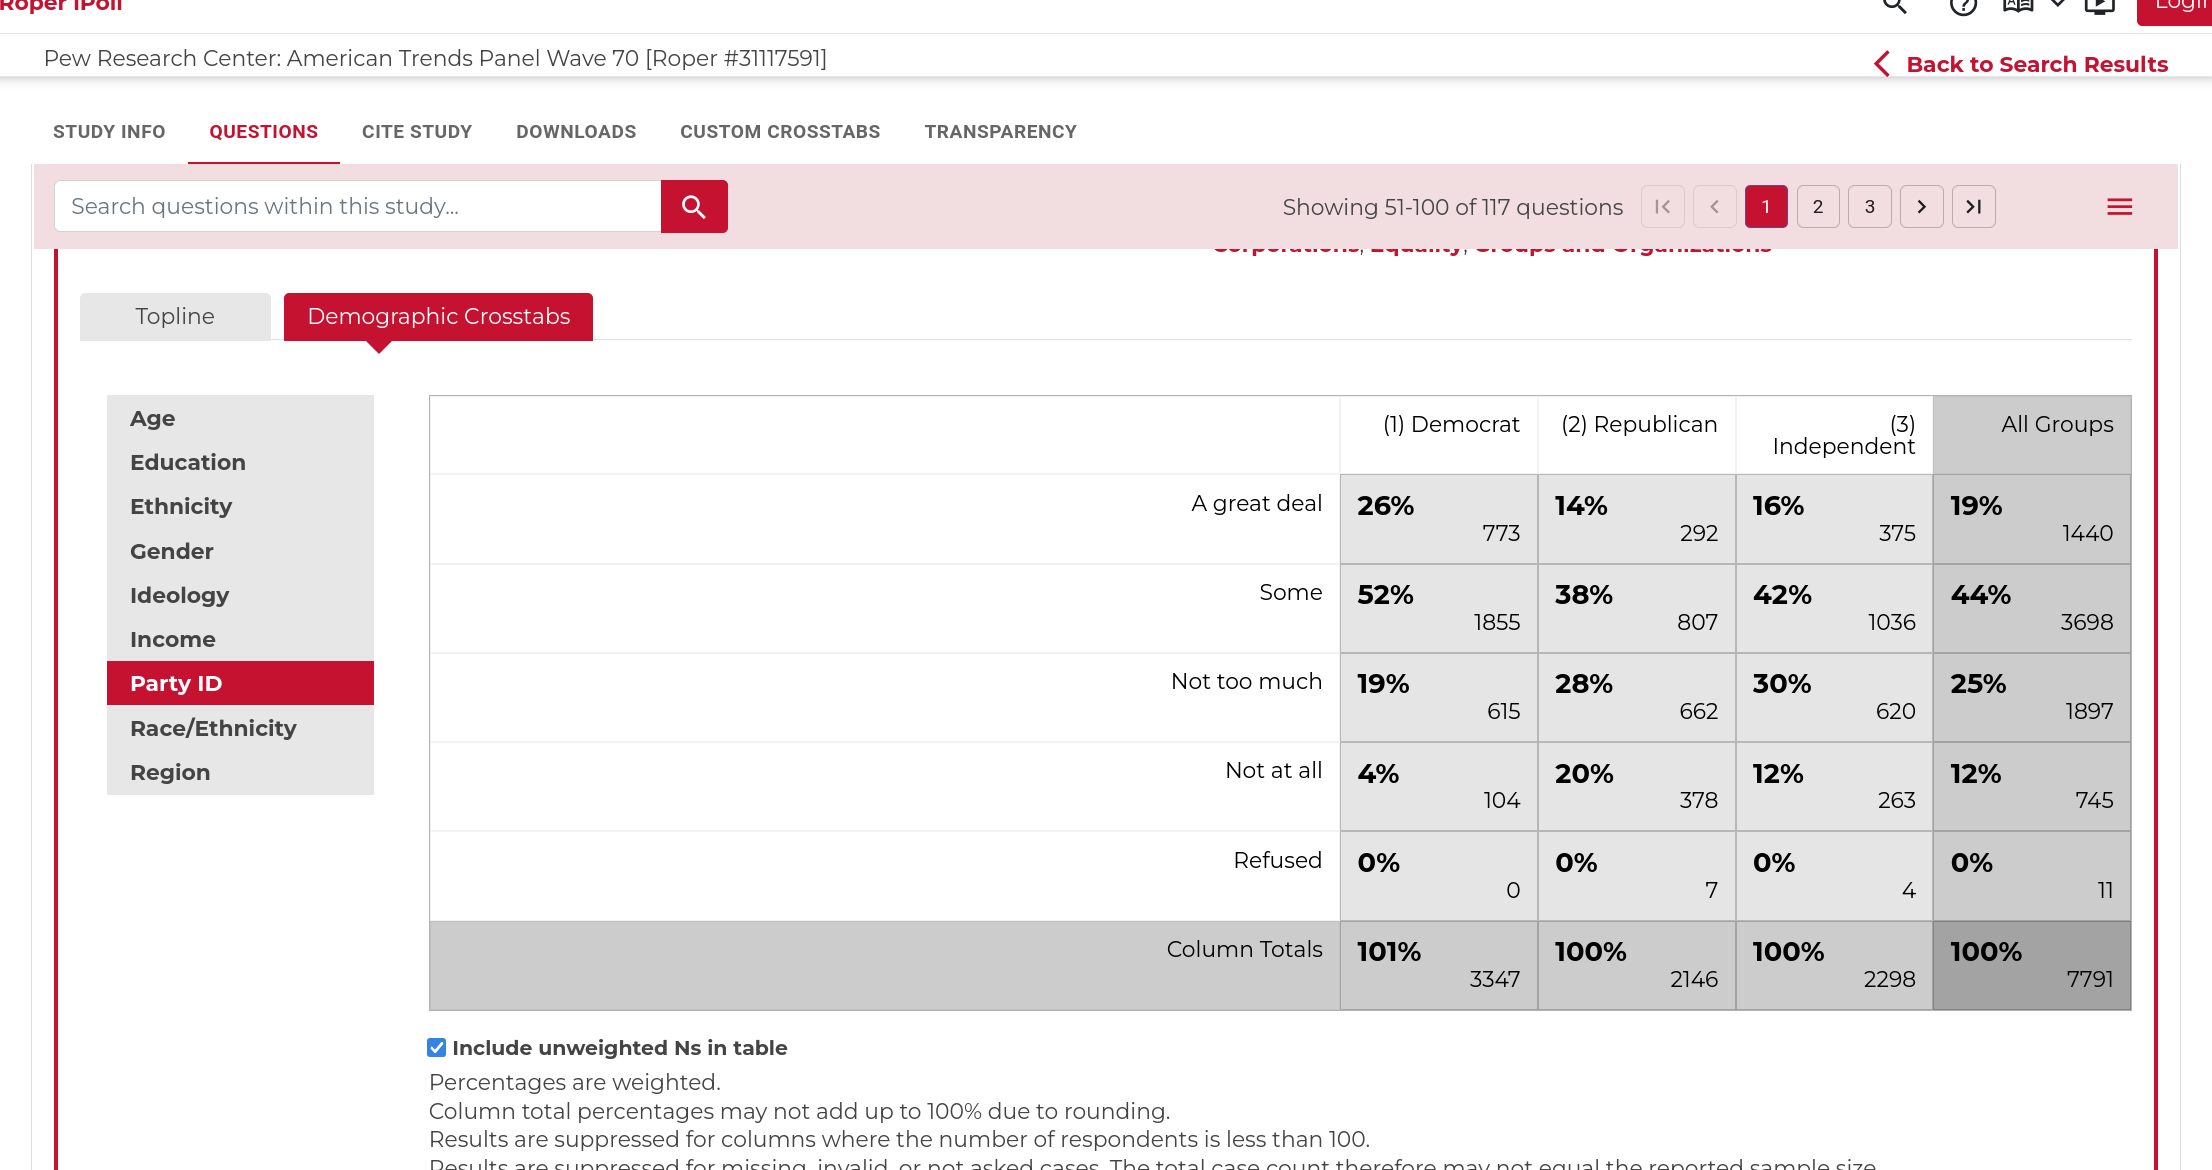
iPoll Example
Once you get there you can select the “Demographic Crosstabs” to look at responses across different groups.

Reading Crosstabs
The crosstabs here show the responses within each column.
- Among Democrats 52% said “Some” and the second largest category was “A great deal” with.
- Among Republicans only 38% said “Some” and the second largest category was “Not too much” with 28%.
Thank You
Questions?