| All Voters | Democrat | Republican | Independent | |
|---|---|---|---|---|
| I’ve seen the ad | 80% | 87% | 79% | 74% |
| I’ve heard of the ad, but have not seen it | 17% | 12% | 15% | 24% |
| I haven't heard about the ad | 2% | 1% | 3% | 2% |
| Not sure | 1% | <1% | 3% | 1% |
| Skipped | <1% | <1% | - | <1% |
| Unweighted N | 836 | 301 | 268 | 251 |
| MoE | 5% | 6% | 8% | 10% |
2026 Miami University Survey of Ohio Voters
Survey
Election
Students in POL 307 fielded their annual survey of Ohio voters. Students wrote questions about AI, foreign policy, data centers, ICE, and abortion; responses to those questions are being reserved for their final projects. We also asked about voting intentions in Ohio’s gubernatorial and Senate races, along with questions about Vivek Ramaswamy’s ad featuring Donna Arthur. In total, there are 841 responses among likely voters. Details on survey sampling and weighting are in the American Associaiton of Political Opinion Research (AAPOR) Disclosure section, and the toplines are also below.
Overall, we find that Acton is currently ahead by 10 percentage points in the gubernatorial race, while Brown is ahead by 7 percentage points in the Senate race. Our counterfactual estimates suggest that Vivek Ramaswamy’s ad featuring Amy Acton’s mother, Donna Arthur, reduced favorability toward Ramaswamy and increased favorability toward Acton. The estimated differences generally follow the same pattern across partisan affiliation and recalled 2024 vote choice. The full results for the Donna Arthur ad are in the section below.
Vote Intention
Table 1 shows the full results for the gubernatorial and Senate races. We find that Amy Acton is leading by 10 percentage points among likely voters, with 52% supporting her compared to 42% supporting Vivek Ramaswamy. A very small percentage of voters are undecided at this point in the race.
The Senate race is slightly closer, with 49% of likely voters indicating they plan to vote or have already voted for Sherrod Brown, and 42% indicating they plan to vote or have already voted for Jon Husted.
The reported margin of error for candidate percentages in this poll is ±6% percentage points. For comparison, the class ran a similar poll in 2024 and found Brown leading Moreno by 2 percentage points, although Brown eventually lost by 4 percentage points. Trump led by 3 percentage points in that poll and won by 11 percentage points. The 2024 poll was not weighted using recalled 2020 vote choice, while the 2026 poll is weighted using recalled 2024 vote choice. The complete weighting process and additional limitations are discussed in the AAPOR Disclosure.
| Gov | Percent |
|---|---|
| Amy Acton | 52% |
| Vivek Ramaswamy | 42% |
| Other | 5% |
| Not Sure | 1% |
| Unweighted N=836, MoE: +/-6% | |
| Senate | Percent |
|---|---|
| Sherrod Brown | 49% |
| Jon Husted | 42% |
| Other | 7% |
| Not Sure | 2% |
| Unweighted N=835, MoE: +/-6% | |
Donna Arthur Ad
Vivek Ramaswamy’s campaign recently released an ad featuring Donna Arthur, Amy Acton’s mother. In the ad, Donna Arthur accuses Acton of being a liar and of making up stories about growing up in poverty. Acton has been estranged from her mother since childhood, after she testified about being sexually assaulted by her mother’s new husband. The ad has been widely seen, with 80% of likely voters having seen it, while another 17% have heard of it but not seen it. Democrats are slightly more likely than Republicans to have seen it (87% versus 79%). Table 2 shows the full breakdown among likely voters.
Asking about the effects of the ad is complicated. The common question “Does this make you more or less likely to vote for a candidate?” often leads to overreporting of change, as voters also use it to express their general opinion of the candidate. Graham and Coppock (2021) document this limitation and propose an alternative counterfactual method. In this approach, voters are first given information about an event and asked their opinion. They are then asked what their opinion would be if they did not know that information. This method also has limitations: voters may not accurately predict their own opinions or behavior in a hypothetical situation. Graham and Coppock (2021) show that counterfactual questions can produce estimates more similar to those from randomized experiments than conventional self-reported-effect questions. Here, most respondents already know about the ad, which limits our ability to use a randomized information experiment to estimate its effect. Our estimates therefore describe differences between respondents’ reported views after reading the information and their hypothetical views without it; they do not establish the ad’s causal effect on actual voting behavior.
To estimate the effect of the ad, we used this two-step counterfactual approach. We first gave participants the following information:
Vivek Ramaswamy recently started to air a campaign ad featuring Donna Arthur, Amy Acton’s mother. In the ad, Donna Arthur accuses Amy Acton of being a liar, including that she lied about having lived in a tent as a child.
In response, Acton’s campaign has highlighted her previous statements that she was sexually abused by her stepfather between the ages of 10 and 12, and that she hasn’t seen her mother since testifying about it in court at age 12.
We then asked participants to rate how favorably they viewed Ramaswamy and Acton. The full results are in Table 3. After reading the information, respondents’ views of Ramaswamy are generally negative, with 31% having a very or somewhat favorable view of him, and 59% having a very or somewhat unfavorable view. In contrast, views of Acton are generally positive, with 47% having a very or somewhat favorable view of her, and 39% having a very or somewhat unfavorable view.
| Candidate | Very favorable | Somewhat favorable | Neither favorable nor unfavorable | Somewhat unfavorable | Very unfavorable | Skipped | Net |
|---|---|---|---|---|---|---|---|
| Ramaswamy | 21% | 9% | 9% | 6% | 53% | 1% | −29% |
| Acton | 36% | 11% | 12% | 9% | 30% | 2% | 8% |
| N=836, MoE: +/-6%. Numbers may not add up to 100% due to rounding. | |||||||
Next, voters were asked to imagine that the Ramaswamy campaign had not run the ad and that they did not know about Acton’s mother’s comments or her relationship with Acton. In this hypothetical situation, respondents report more favorable views of Ramaswamy and slightly less favorable views of Acton than they do after reading the information. In particular, 38% report a favorable view of Ramaswamy, and 53% report an unfavorable view. Meanwhile, 46% report a favorable view of Acton, and 40% report an unfavorable view of her. The full breakdown is in Table 4.
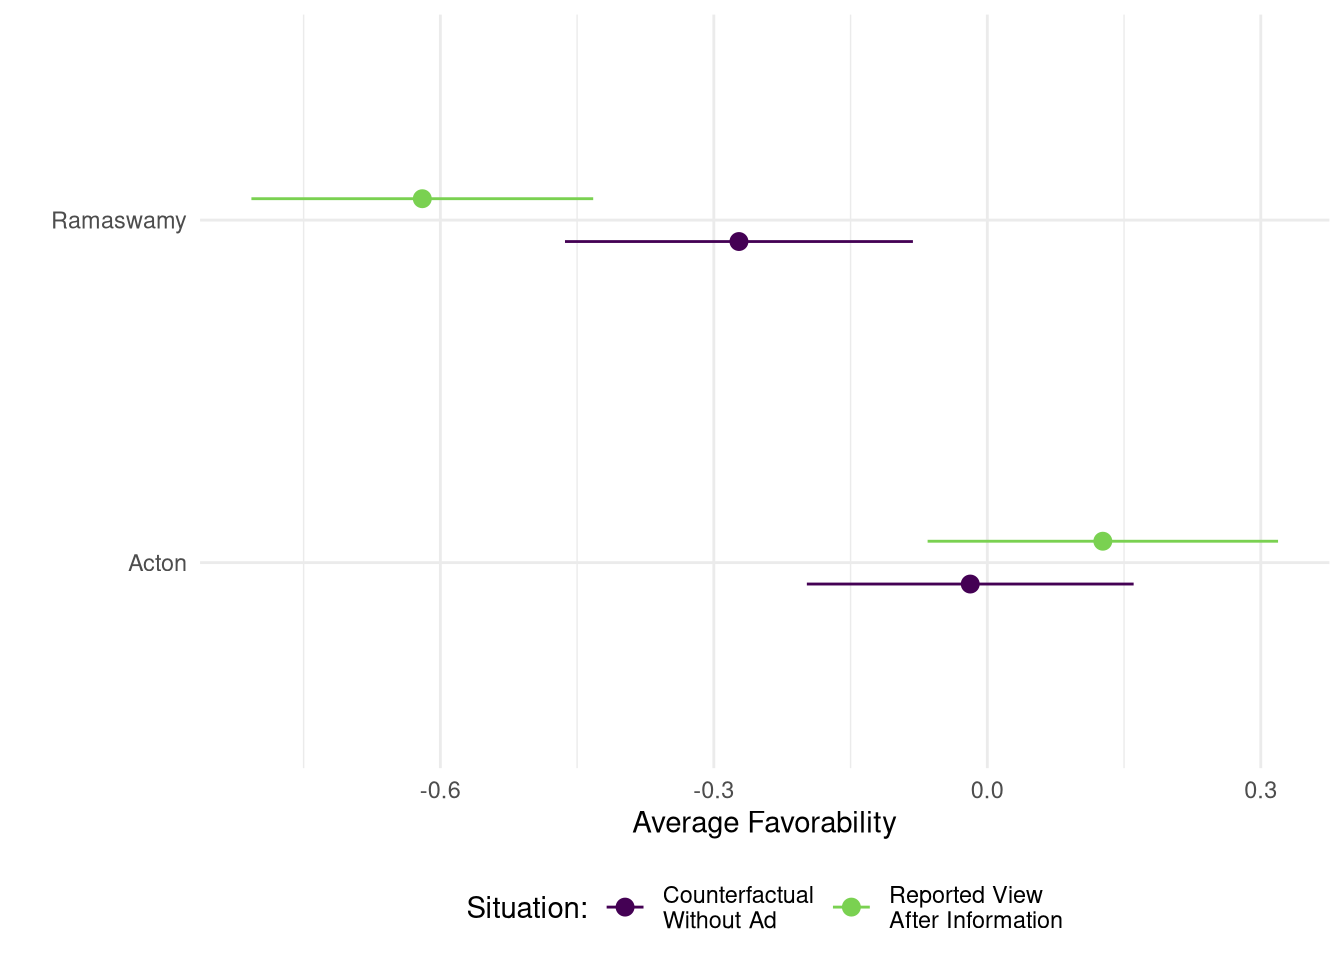
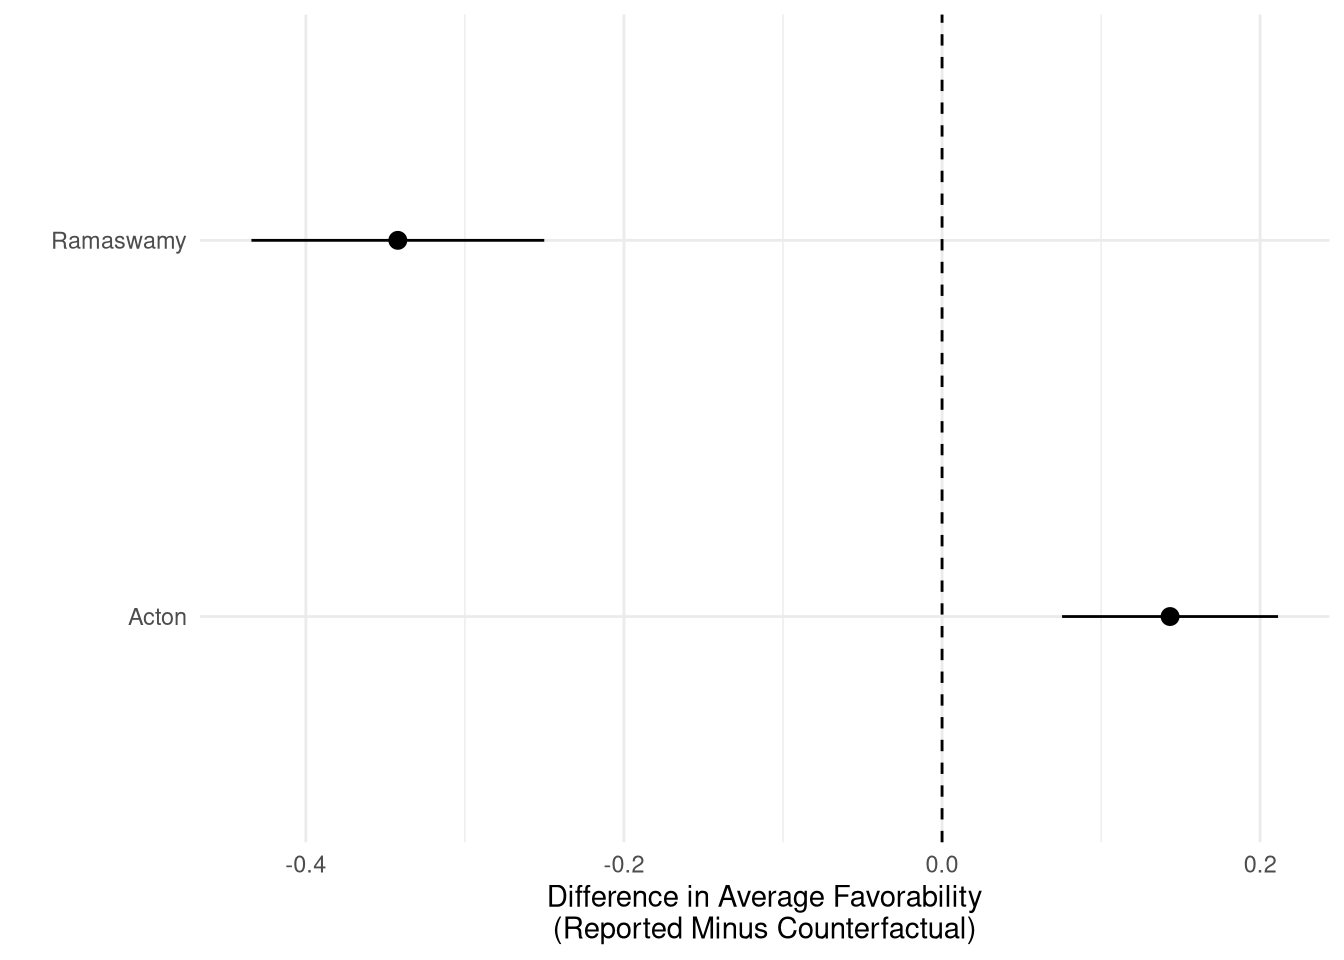
To better understand these differences, Figure 1 shows each candidate’s average favorability, with responses scored from -2 (very unfavorable) to 2 (very favorable). Ramaswamy’s average score after respondents read the information is -0.62, compared to -0.27 in the hypothetical situation without the ad. We calculate each respondent’s difference as their reported score after reading the information minus their counterfactual score. The average difference for Ramaswamy is -0.34 points. For Acton, the difference runs in the opposite direction: her average reported score is 0.13, compared to a counterfactual score of -0.02, with an average within-respondent difference of 0.14 points. Negative differences indicate less favorable reported views than counterfactual views; positive differences indicate more favorable reported views. Figure 2 shows these estimated differences with 95% confidence intervals. These are self-reported counterfactual comparisons, not observed changes from a randomized experiment.
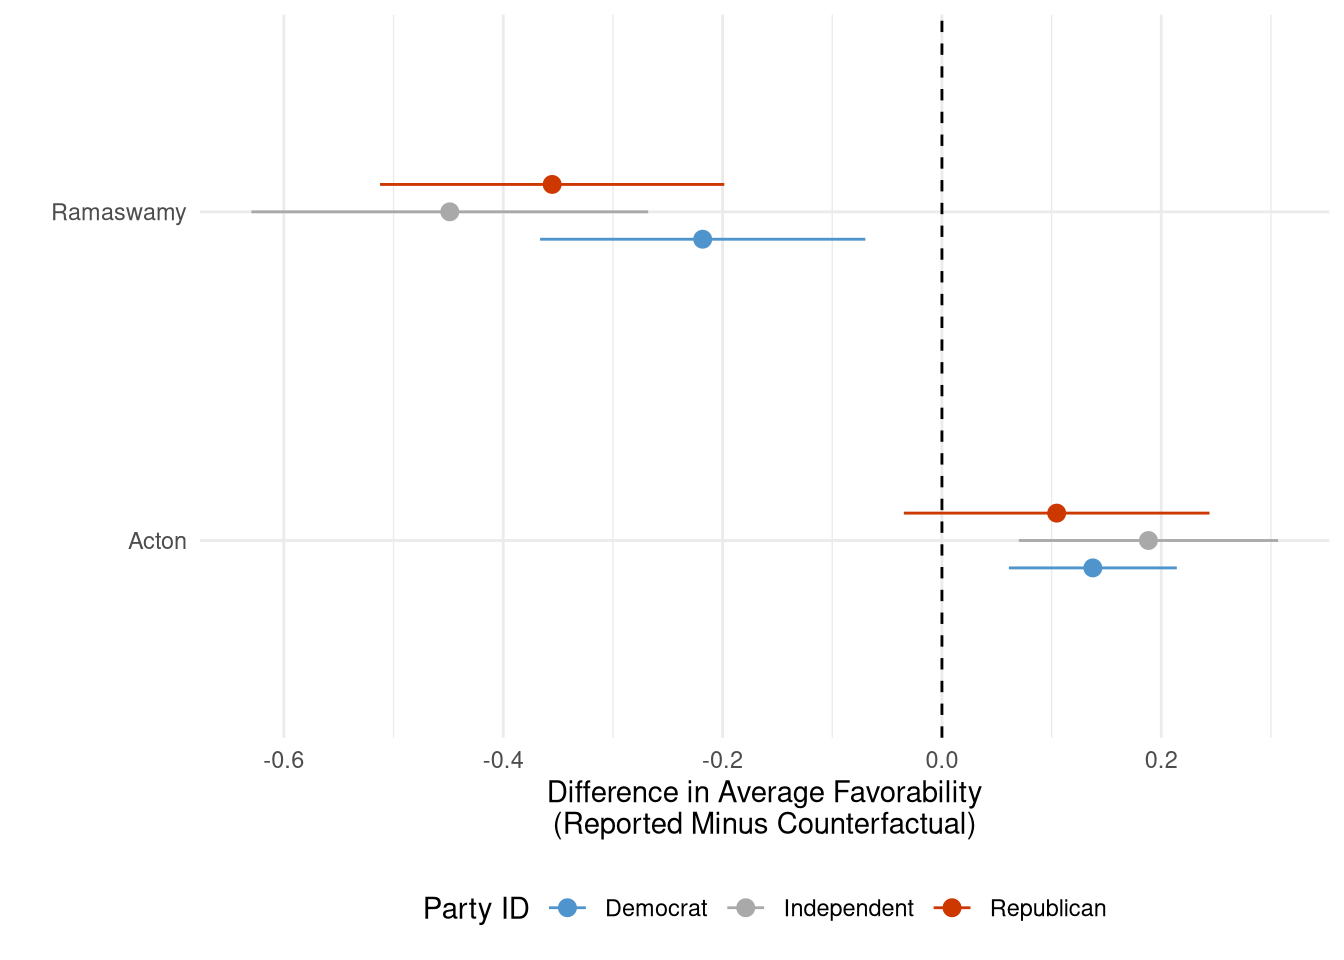
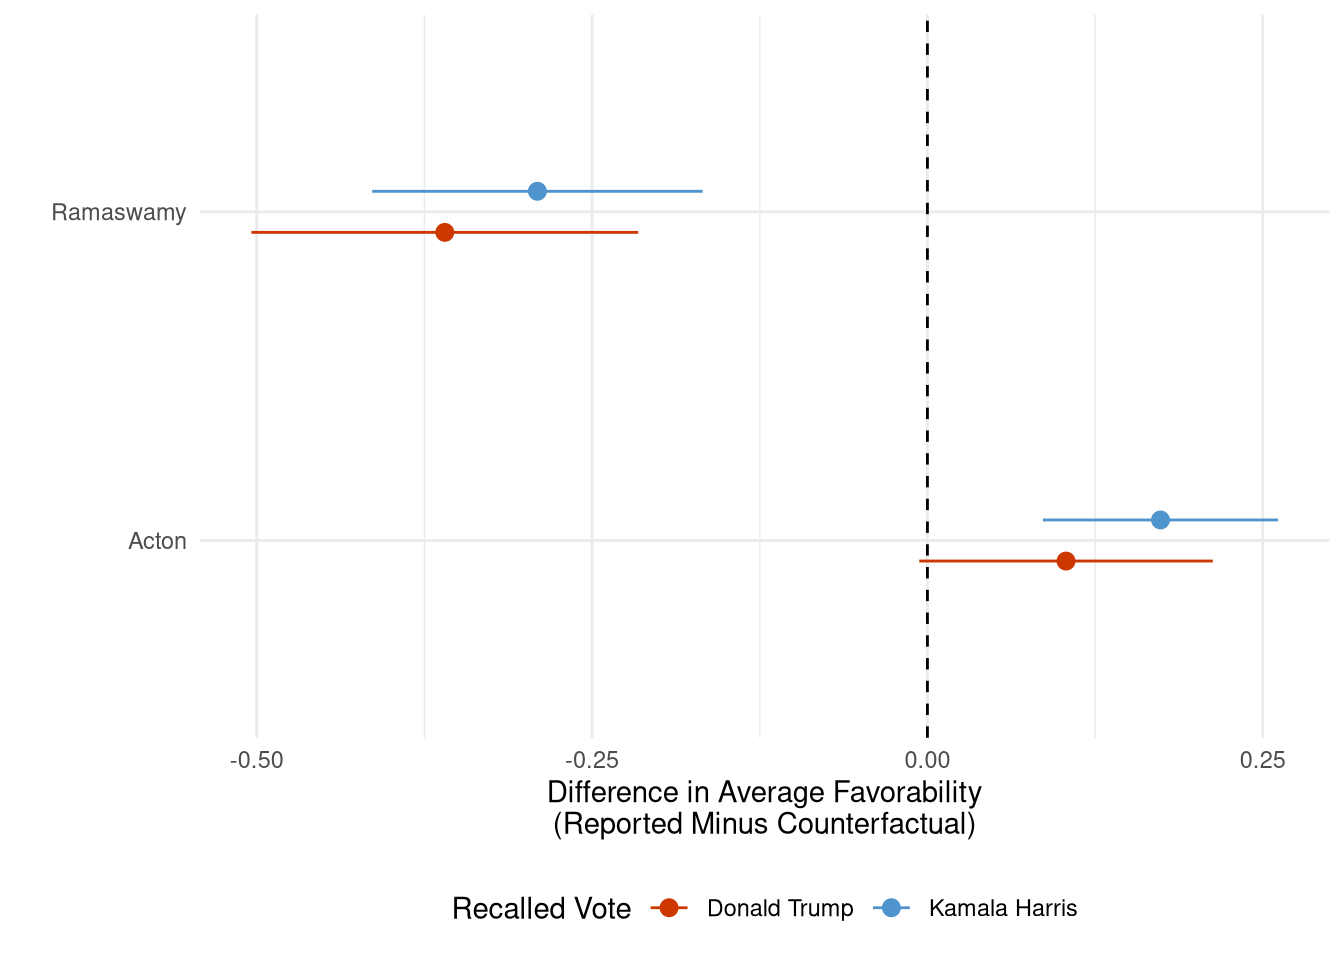
The estimated differences generally follow the same pattern across partisan identification and recalled 2024 presidential vote choice. Figure 3 shows the differences by partisan identification. Both Democrats and Republicans report less favorable views of Ramaswamy after reading the information than in the hypothetical situation without the ad. The estimated difference is smaller for Democrats, which may reflect the fact that even in the counterfactual (where Ramaswamy hadn’t run the ad) they would have had relatively negative perceptions of him. Independents have the largest estimated difference for Ramaswamy, at -0.45 points. Figure 4 shows the corresponding differences among respondents who recall voting for Trump or Harris in 2024. These subgroup comparisons describe reported and hypothetical evaluations; they do not independently establish causal effects.
AAPOR Disclosure
The data come from a survey of 841 likely voters in Ohio, fielded from October 26–29, 2026. The sampling frame was purchased from L2 Data, and a random sample of registered voters with cell phones was drawn from it. The survey was sponsored by the Menard Family Center for Democracy. The full survey language can be found here.
Participants were recruited using text messages and then completed the survey online. The sample was weighted using raking to match Ohio registered voters on education (3 categories), race (white/non-white) by sex, age (3 categories), recalled vote for the 2024 election, party registration, and vote history. The targets for the last two variables were taken from L2 voter file data, while the remaining variables (except recalled vote choice) were from the CPS November 2024 Voter Supplement. For recalled vote choice, we assumed that those who either did not vote or could not recall who they voted for would make up 5% of votes in the 2024 election (down weighting the actual results by this amount). After weighting, we applied a screen, removing voters who said they would definitely not vote or were unsure whether they would vote..
The tables below show results for likely voters. The overall margin of error is ±6% percentage points. This captures only sampling error and does not account for errors arising from question wording, sampling-frame overcoverage or undercoverage, or other sources. Our student researchers identify themselves as Miami University students in their introductory text message, which leads to a higher response rate among more educated voters. Although weighting can reduce this bias, it cannot necessarily eliminate it.
Toplines
The tables below show the toplines for election-related questions and demographics. Responses to questions written by students are being reserved for their final projects.
| Response | Estimate |
|---|---|
| Do you intend to vote in the November 2026 general election? | |
| I already voted (early or absentee) | 29% |
| Yes, definitely | 66% |
| Probably | 5% |
| Have you seen the Vivek Ramaswamy campaign ad that features Amy Acton’s mother, Donna Arthur? | |
| I’ve seen the ad | 80% |
| I’ve heard of the ad, but have not seen it | 16% |
| I haven't heard about the ad | 2% |
| Not sure | 1% |
| Skipped | <1% |
| Vivek Ramaswamy recently started to air a campaign ad featuring Donna Arthur, Amy Acton’s mother. In the ad, Donna Arthur accuses Amy Acton of being a liar, including that she lied about having lived in a tent as a child. In response, Acton’s campaign has highlighted her previous statements that she was sexually abused by her stepfather between the ages of 10 and 12, and that she hasn't seen her mother since testifying about it in court at age 12. Based on the information you just read, do you have a favorable or unfavorable view of the following candidates?: Vivek Ramaswamy | |
| Very favorable | 21% |
| Somewhat favorable | 9% |
| Neither favorable nor unfavorable | 9% |
| Somewhat unfavorable | 6% |
| Very unfavorable | 53% |
| Skipped | 1% |
| Vivek Ramaswamy recently started to air a campaign ad featuring Donna Arthur, Amy Acton’s mother. In the ad, Donna Arthur accuses Amy Acton of being a liar, including that she lied about having lived in a tent as a child. In response, Acton’s campaign has highlighted her previous statements that she was sexually abused by her stepfather between the ages of 10 and 12, and that she hasn't seen her mother since testifying about it in court at age 12. Based on the information you just read, do you have a favorable or unfavorable view of the following candidates?: Amy Acton | |
| Very favorable | 35% |
| Somewhat favorable | 11% |
| Neither favorable nor unfavorable | 12% |
| Somewhat unfavorable | 10% |
| Very unfavorable | 30% |
| Skipped | 2% |
| Suppose that the Ramaswamy campaign had not run the ad featuring Amy Acton's mother, and so you did not know about Acton's mother's comments or her relationship with Amy Acton. What would your opinion of the following candidates be then?: Vivek Ramaswamy | |
| Very favorable | 27% |
| Somewhat favorable | 11% |
| Neither favorable nor unfavorable | 7% |
| Somewhat unfavorable | 15% |
| Very unfavorable | 38% |
| Skipped | 1% |
| Suppose that the Ramaswamy campaign had not run the ad featuring Amy Acton's mother, and so you did not know about Acton's mother's comments or her relationship with Amy Acton. What would your opinion of the following candidates be then?: Amy Acton | |
| Very favorable | 26% |
| Somewhat favorable | 20% |
| Neither favorable nor unfavorable | 12% |
| Somewhat unfavorable | 10% |
| Very unfavorable | 32% |
| Skipped | 2% |
| Generally speaking, do you think of yourself as a...? | |
| Democrat | 30% |
| Republican | 38% |
| Independent | 21% |
| Other | 9% |
| Not Sure | 2% |
| Skipped | <1% |
| Who did you vote for in the 2024 Presidential election? | |
| Donald Trump (Republican) | 49% |
| Kamala Harris (Democratic) | 45% |
| Someone else | 1% |
| Couldn't vote | 1% |
| Didn't vote | 3% |
| Don't remember | <1% |
| Skipped | <1% |
| What is the highest level of education you have completed? | |
| Some high school or less | 1% |
| High school diploma or GED | 14% |
| Some college, but no degree | 33% |
| Associates or technical degree | 25% |
| Bachelor’s degree | 15% |
| Graduate or professional degree (MA, MS, MBA, PhD, JD, MD, DDS etc.) | 10% |
| Prefer not to say | 2% |
| Skipped | <1% |
| Which race(s) and ethnicity(ies) do you consider yourself to be?: White or Caucasian (non-Hispanic) | |
| Yes | 81% |
| No | 19% |
| Which race(s) and ethnicity(ies) do you consider yourself to be?: Hispanic or Latino | |
| Yes | 5% |
| No | 95% |
| Which race(s) and ethnicity(ies) do you consider yourself to be?: Black or African American | |
| Yes | 9% |
| No | 91% |
| Which race(s) and ethnicity(ies) do you consider yourself to be?: American Indian/Native American or Alaska Native | |
| Yes | 2% |
| No | 98% |
| Which race(s) and ethnicity(ies) do you consider yourself to be?: Asian | |
| Yes | 1% |
| No | 99% |
| Which race(s) and ethnicity(ies) do you consider yourself to be?: Native Hawaiian or Other Pacific Islander | |
| No | 100% |
| Which race(s) and ethnicity(ies) do you consider yourself to be?: Something else | |
| Yes | 2% |
| No | 98% |
| Which race(s) and ethnicity(ies) do you consider yourself to be?: Prefer not to say | |
| Yes | 7% |
| No | 93% |
| What is your gender? | |
| Man | 51% |
| Woman | 47% |
| Non-binary / third gender | 2% |
| NA | <1% |
| What was your total household income before taxes during the past 12 months? | |
| Less than $25,000 | 9% |
| $25,000-$49,999 | 13% |
| $50,000-$74,999 | 15% |
| $75,000-$99,999 | 14% |
| $100,000-$149,999 | 17% |
| $150,000 or more | 21% |
| Prefer not to say | 9% |
| Skipped | 1% |
| If the election for Governor and Lt. Governor were held today--who would you vote for? OR Confidentially and for statistical purposes only, who did you vote for in the election for Governor and Lt. Governor? | |
| Acton | 51% |
| Ramaswamy | 41% |
| Kissick | 4% |
| Other | 1% |
| Not voting | 1% |
| Not sure | 1% |
| And what if the election for US Senate were held today--who would you vote for? OR Again, confidentially and for statistical purposes only, who did you vote for in the election for US Senate? | |
| Brown | 49% |
| Husted | 42% |
| Levy | 1% |
| Redpath | 4% |
| Other | 2% |
| Not voting | 1% |
| Not sure | 2% |
| Skipped | <1% |
| Party Identification | |
| Strong Democrat | 25% |
| Weak Democrat | 5% |
| Lean Democrat | 15% |
| True Independent | 8% |
| Lean Republican | 9% |
| Weak Republican | 10% |
| Strong Republican | 28% |
| Skipped | <1% |
| Age in 4 categories | |
| <30 | 13% |
| 31-45 | 34% |
| 46-60 | 18% |
| 61+ | 32% |
| Skipped | 3% |