Analyzing Survey Data in Qualtrics
For the final project, you can complete all of the analysis in Qualtrics. To do this, I will give you two files: an export of the Qualtrics survey instrument (a .qsf file) and the data in a format Qualtrics can read (a .csv file). This tutorial walks through loading both of those into Qualtrics, setting up the survey weights, calculating univariate statistics and crosstabs, and exporting your results.
Importing the Survey Instrument
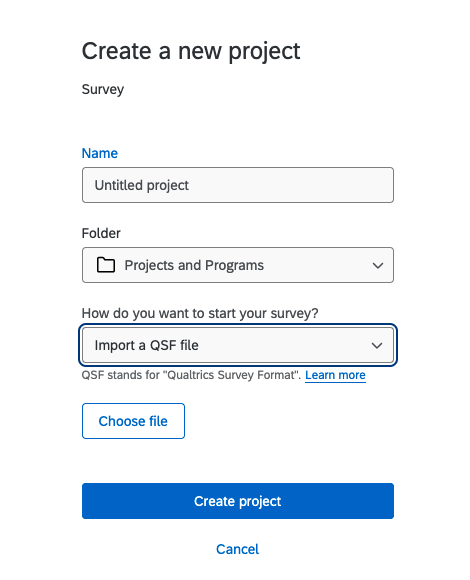
First, create a new project in Qualtrics and choose a simple survey “From Scratch.” When it asks you to name the survey, enter a name. Then, in the “How do you want to start your survey?” dropdown, select “Import a QSF file” and upload the QSF file I’ve provided (Figure 1). This recreates all of the questions and response options from the original survey.
Importing the Data
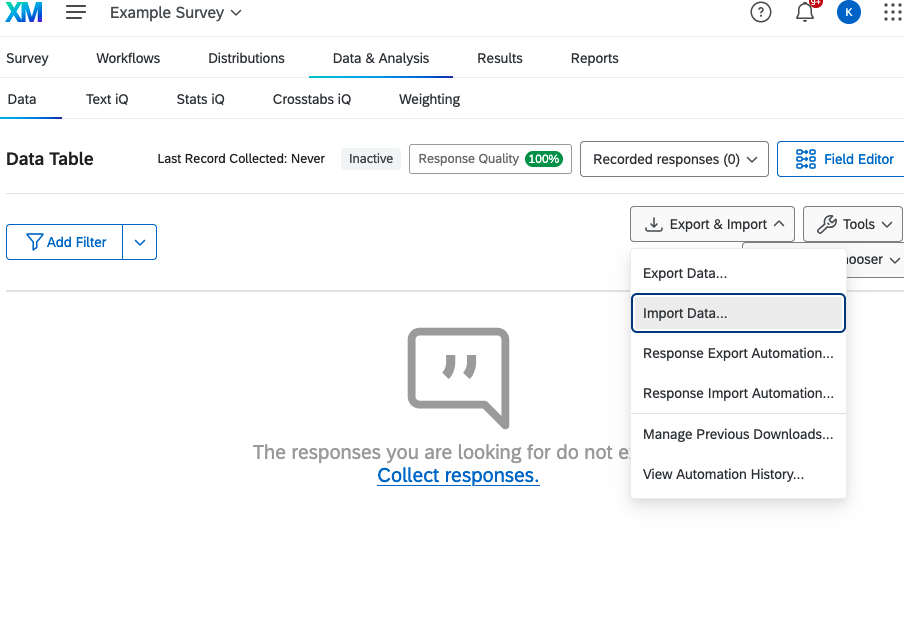
Once you have the survey, select the “Data & Analysis” tab, open the “Export & Import” menu, and click “Import Data…” (Figure 2). Upload the CSV file and leave the “Delimiter” option set to “Comma.”
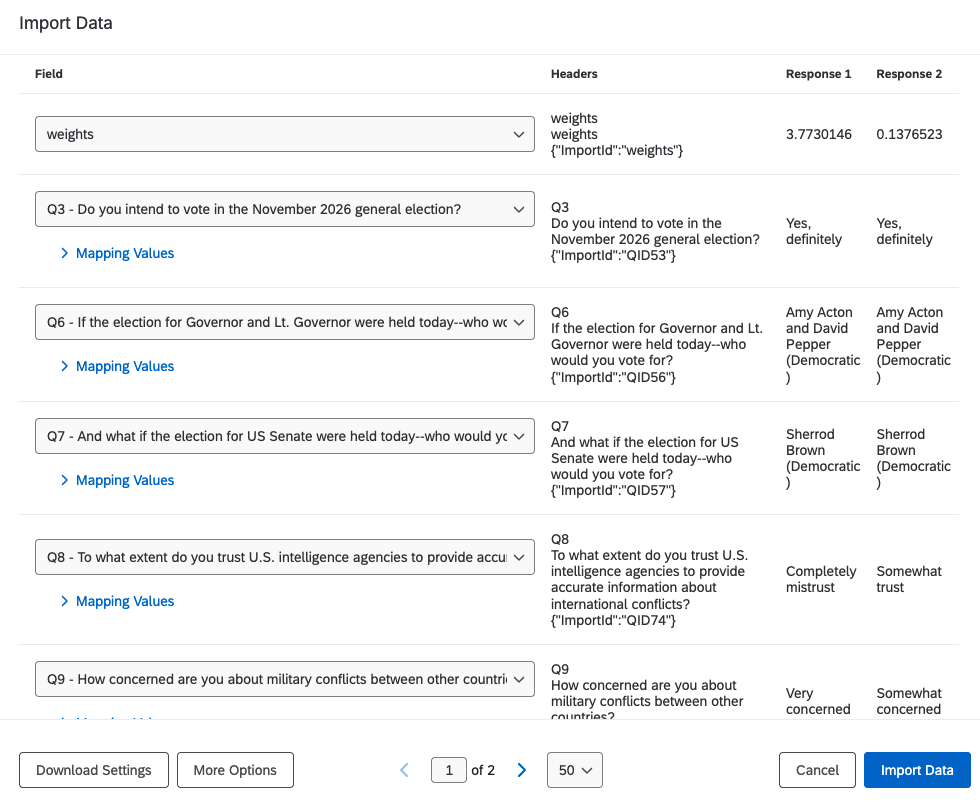
You should then see a menu connecting the columns in your data to the questions in the survey (Figure 3). Because the data and survey came from the same place, you should not have to make any changes here. If you do see a column that isn’t matched to a question, double check that you uploaded the correct files.
Setting Up the Analysis
To analyze your data, go to the “Data & Analysis” tab and then the “Stats iQ” tab within it. The first time you do this, it might take some time for it to “Prepare your dataset for analysis.”
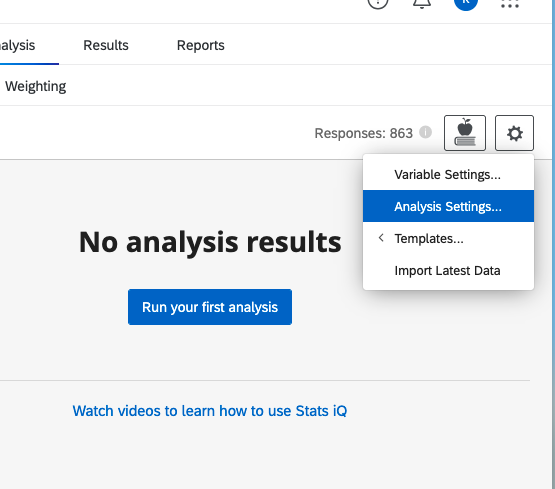
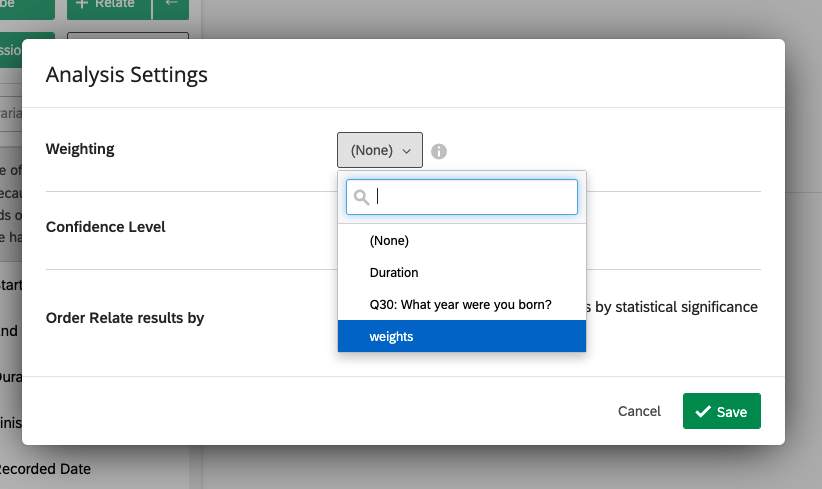
Survey weights adjust how much each respondent counts so that the sample better matches the population. To use the survey weights, you need to set up Stats iQ to recognize them. Click on the gear icon in the top right of the Stats iQ page and pick “Analysis Settings…” (Figure 4). Then, in the Weighting dropdown, pick “weights” (or whatever the weight variable is called in your data, see Figure 5).
Calculating Univariate Stats
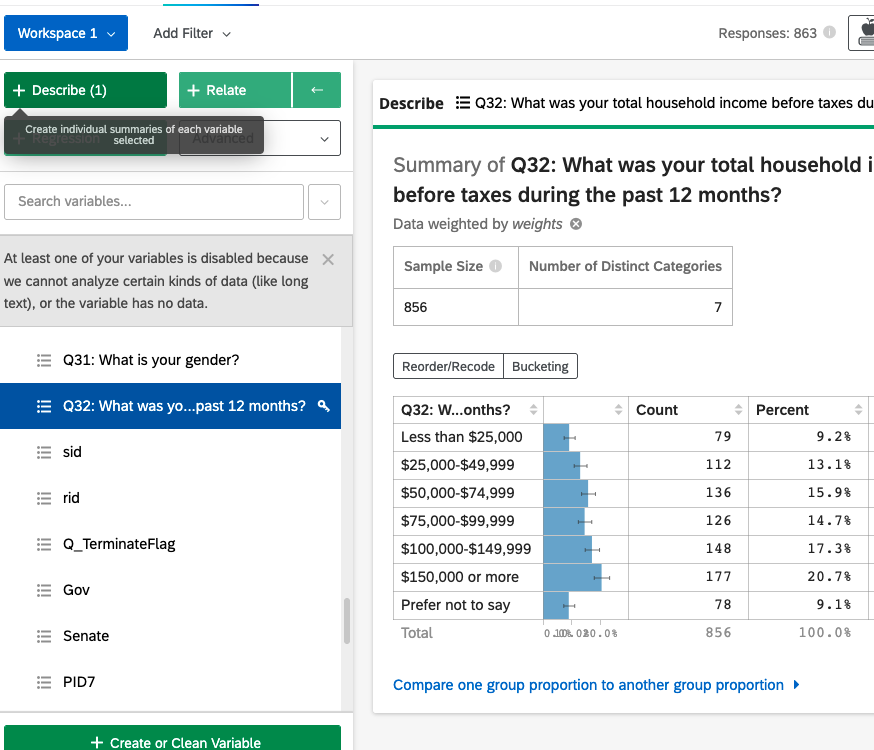
To calculate responses for a single variable, select that question/variable on the left side and then click the “Describe” button above it (Figure 6). This will show you the weighted proportion for each response category, along with its 95% confidence interval.
Bucketing
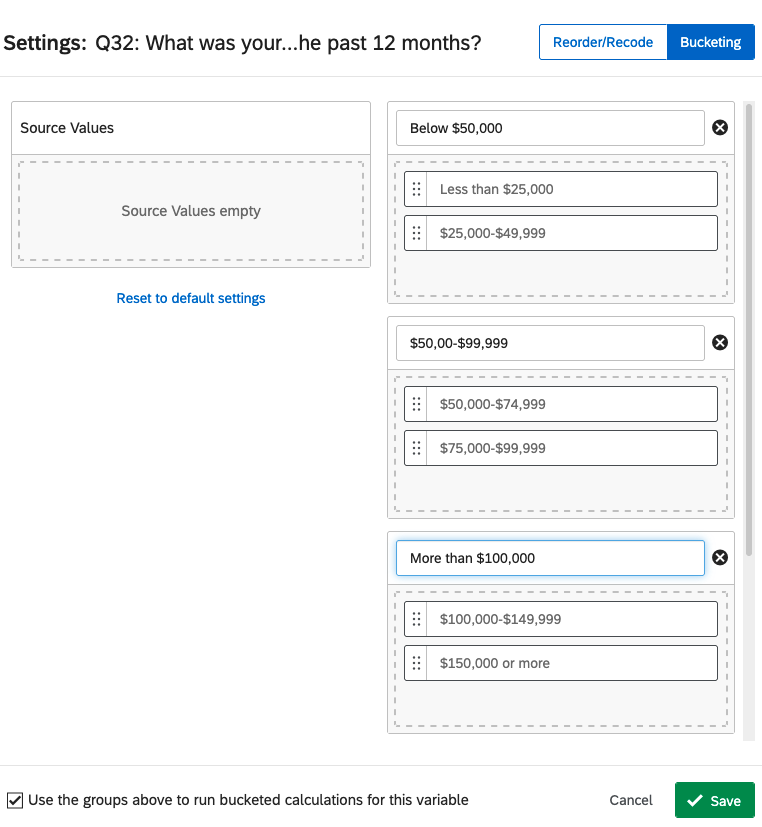
If you have some categories that you want to combine (for example, combining “Strongly agree” and “Somewhat agree” into a single “Agree” category), you can select “Bucketing” and drag and drop the categories together (Figure 7). Click “+ New Group” to create new groups and click on the title of the bucket to change its label.
Filtering Data
You can filter data in two different ways. If you want to apply a single filter to the whole dataset, use “Add Filter” on the left side. If you want to filter for a specific question/analysis (to drop a small category, for example), use the “Filter” button on the right above that section of the analysis.
Crosstabs
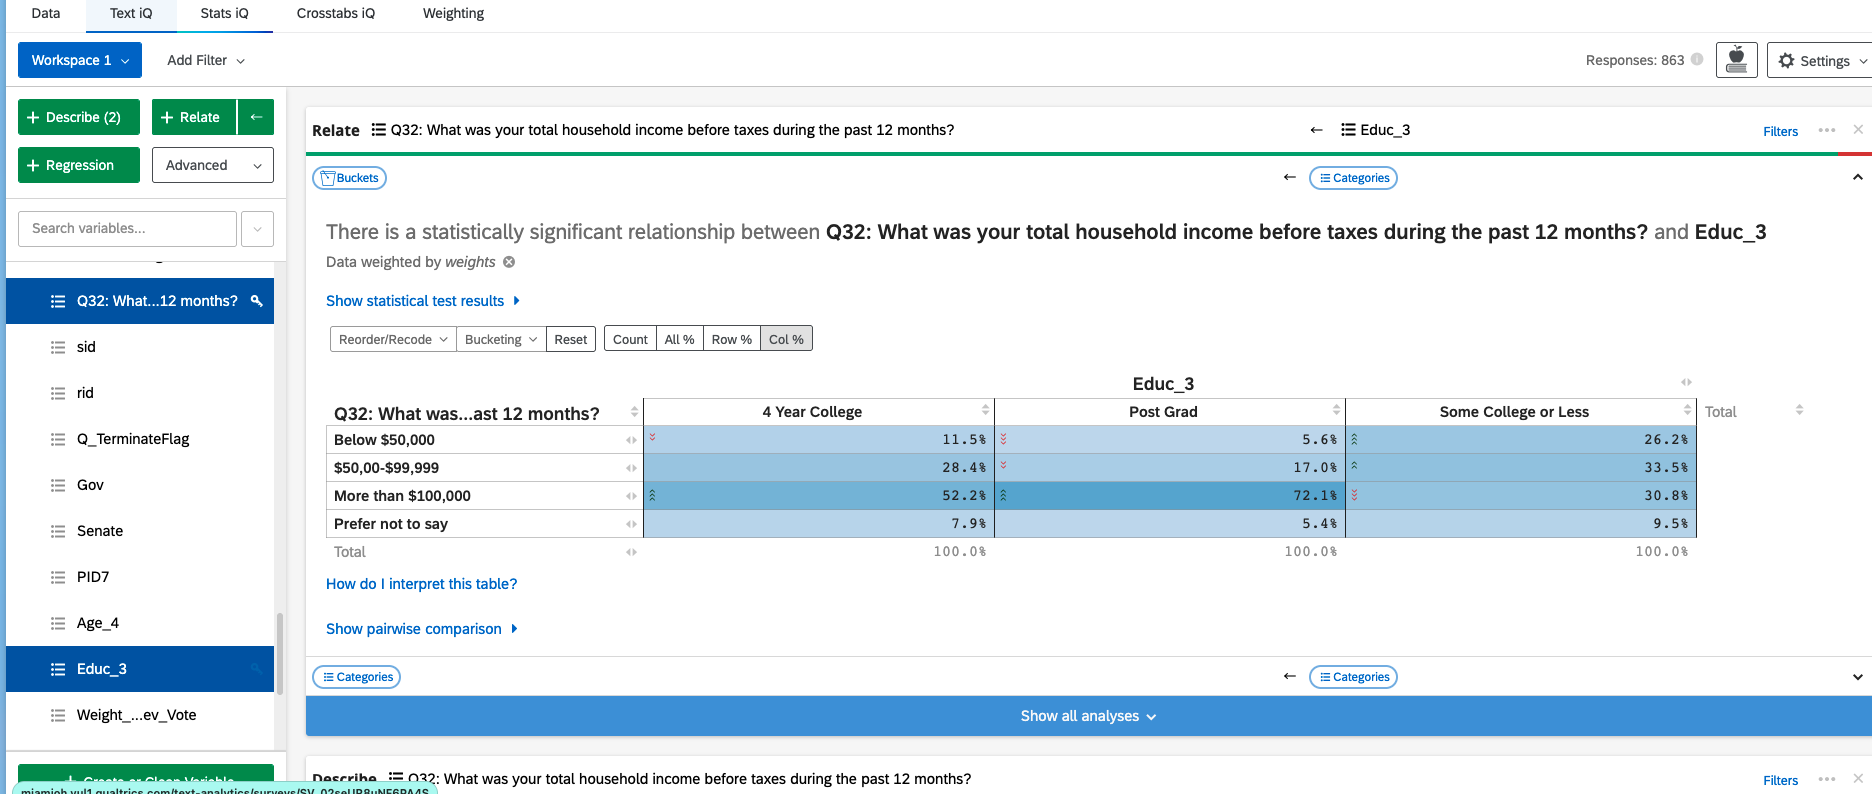
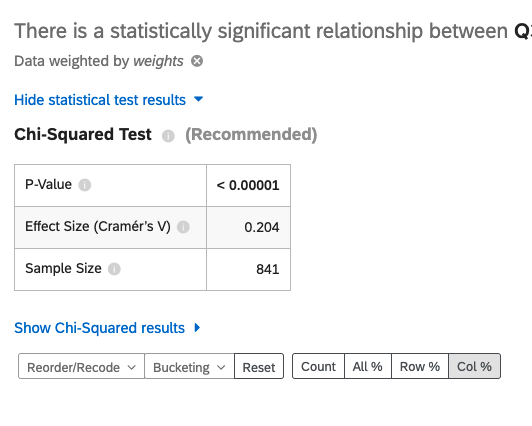
To do crosstabs, select two variables on the left and then click the “Relate” button (Figure 8). To see the \(\chi^2\) test, select “Show statistical test results,” which will show the test statistic and its p-value (Figure 9).
Exporting Everything
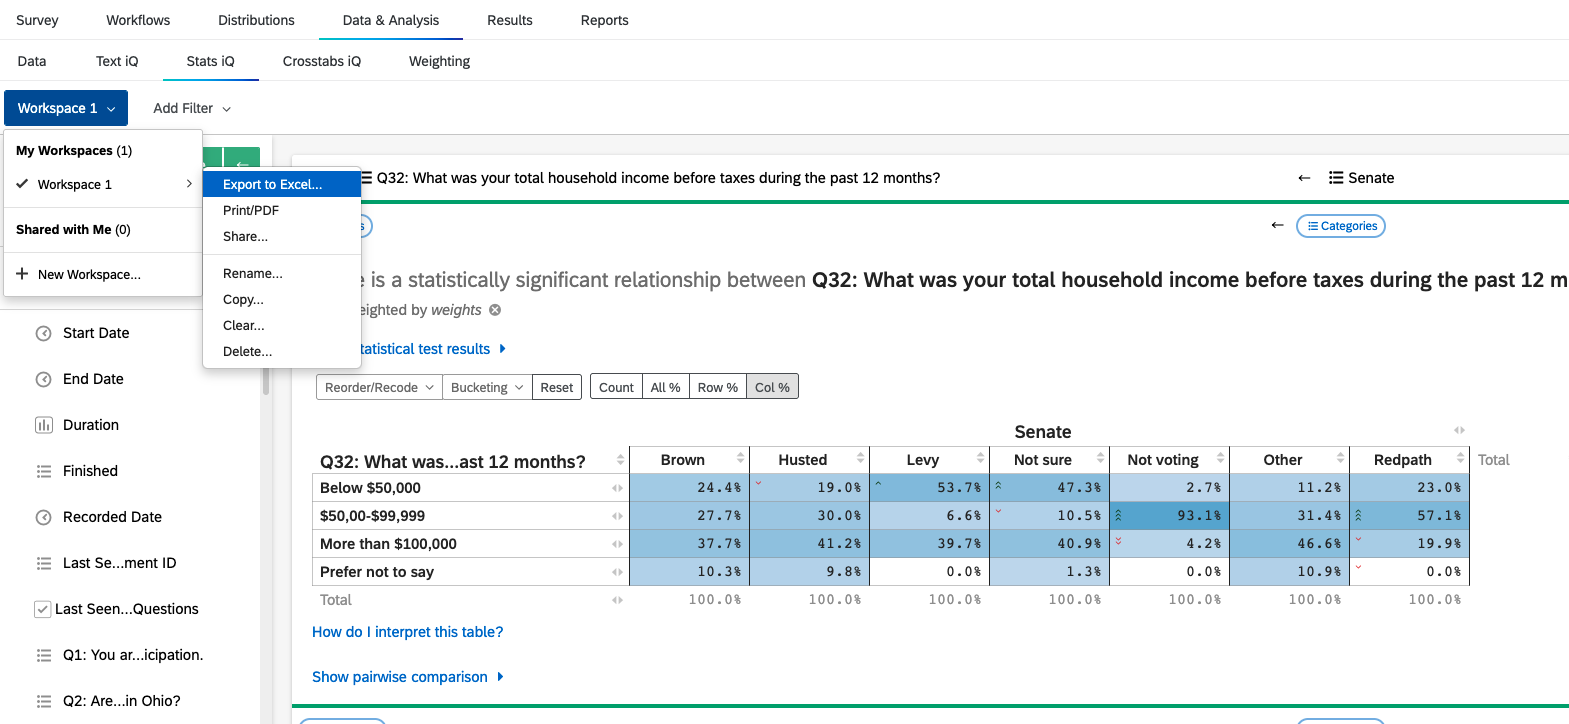
As you go, you’ll collect more analyses. You can export all of them at once by clicking on the “Workspace” button in the top left and selecting your workspace from the menu. In the new menu that appears, select “Export to Excel” (Figure 10).
Things I Find Strange About Qualtrics
- The confidence intervals in Excel are in a single cell. You can separate each interval into two cells by highlighting the column and using “Text to Columns.” Use the “Delimited” option and “Space” as a delimiter.
- Your analyses appear as separate “Cards.” Leave them like that so you can export them all at the end. If you decide not to use a card, click the X on its top right.
- If you create buckets, Qualtrics will use those, but there should be a “Categories <- Categories” bar below the bucket analysis. This will show you the raw data.
- You can click on multiple variables at once and analyze them all at once. Click on a variable again to unselect it.
- No, it doesn’t directly show you the Margin of Error. You will have to look through your results to see what the largest Margin of Error is (half the width of the confidence interval) and report that somewhere.